Hallo zusammen,
ich habe mich hier durch die Performance-Optimierungsideen durchgelesen. Dadurch habe ich angefangen meinen Shop genauer zu untersuchen.
Das Debuglevel habe ich auf “-1” gesetzt und erhalte unten stehende Ausgaben. Besonders auffällig erscheinen mir nur folgende beiden:
cl=oxwarticledetails(show/hide)
Memory usage: 6.111 MB (peak: 146.438 MB)
System memory usage: 27 MB (peak: 147 MB)
Executed: 2018-06-22 09:46:42
Timestamp: 1529653602.8083
Execution time:3.6349

cl=details(show/hide)
Memory usage: 7.898 MB (peak: 146.438 MB)
System memory usage: 27 MB (peak: 147 MB)
Executed: 2018-06-22 09:46:42
Timestamp: 1529653602.8303
Execution time:7.2862
-------------------------
Insbesondere die Ausführung mit über 7 Sekunden. Was wird da konkret geladen?
Die Datenbank läuft daher auf einer SSD. Ich denke eine gute IO ist für eine große DB wichtiger als der Speicherplatz.
Die oxarticles Tabelle ist aktuell 1,8GB groß
Was mich wundert: Auf der Shopstartseite werden die Artikel “Frisch eingetroffen” angezeigt. Die Startseite lädt ruck zuck.
Habt ihr eine Idee was hier die hohe Laufzeit verursacht?
Viele Grüße
cl=oxwcookienote(show/hide)
Memory usage: 6.262 MB (peak: 146.438 MB)
System memory usage: 27 MB (peak: 147 MB)
Executed: 2018-06-22 09:46:42
Timestamp: 1529653602.8101
Execution time:0.0011
----------------------------------------------------------
Profile process: 	3.63575s	325217.15% 	3	*	1.21192s
Profile oxNew: 	0.01922s	1719.22% 	103	*	0.00019s
Profile oxAutoload: 	0.00694s	620.99% 	89	*	8.0E-5s
Profile buildTree: 	0.00351s	314.33% 	1	*	0.00351s
Profile articleAssign: 	0.001s	89.25% 	3	*	0.00033s
Profile smarty_function_oxmultilang: 	0.00068s	60.95% 	25	*	3.0E-5s
Profile seoencoder_loadFromCache: 	0.00052s	46.43% 	12	*	4.0E-5s
Profile _getAmountPrice: 	0.00049s	44.19% 	1	*	0.00049s
Profile _getLangTranslationArray: 	0.00043s	38.45% 	33	*	1.0E-5s
Profile loadinglists: 	0.00031s	27.98% 	2	*	0.00016s
Profile executeMaintenanceTasks: 	0.00027s	24.06% 	1	*	0.00027s
Profile getArticleUri: 	0.00021s	19.15% 	4	*	5.0E-5s
Profile getCategoryUri: 	0.00016s	14.05% 	2	*	8.0E-5s
Profile _assignPriceInternal: 	7.0E-5s	6.53% 	1	*	7.0E-5s
Profile oxviewconfig::getViewConfigParam: 	3.0E-5s	2.6% 	19	*	0s
Profile isSearchEngine: 	2.0E-5s	1.34% 	1	*	2.0E-5s
Profile fround: 	1.0E-5s	1.24% 	9	*	0s
Profile articleAssignParentInternal: 	1.0E-5s	0.9% 	3	*	0s
Profile oxviewconfig::setViewConfigParam: 	1.0E-5s	0.7% 	10	*	0s
Profile _applyVAT: 	1.0E-5s	0.62% 	2	*	0s


cl=oxwlanguagelist(show/hide)
Memory usage: 6.395 MB (peak: 146.438 MB)
System memory usage: 27 MB (peak: 147 MB)
Executed: 2018-06-22 09:46:42
Timestamp: 1529653602.8123
Execution time:0.0013
----------------------------------------------------------
Profile process: 	3.63706s	276157.17% 	4	*	0.90926s
Profile oxNew: 	0.01964s	1491.53% 	106	*	0.00019s
Profile oxAutoload: 	0.00702s	533.11% 	90	*	8.0E-5s
Profile buildTree: 	0.00351s	266.82% 	1	*	0.00351s
Profile articleAssign: 	0.001s	75.76% 	3	*	0.00033s
Profile smarty_function_oxmultilang: 	0.00068s	51.74% 	25	*	3.0E-5s
Profile seoencoder_loadFromCache: 	0.00052s	39.41% 	12	*	4.0E-5s
Profile _getAmountPrice: 	0.00049s	37.51% 	1	*	0.00049s
Profile _getLangTranslationArray: 	0.00044s	33.09% 	34	*	1.0E-5s
Profile loadinglists: 	0.00031s	23.75% 	2	*	0.00016s
Profile executeMaintenanceTasks: 	0.00027s	20.42% 	1	*	0.00027s
Profile getArticleUri: 	0.00021s	16.26% 	4	*	5.0E-5s
Profile getCategoryUri: 	0.00016s	11.93% 	2	*	8.0E-5s
Profile _assignPriceInternal: 	7.0E-5s	5.54% 	1	*	7.0E-5s
Profile oxviewconfig::setViewConfigParam: 	5.0E-5s	3.87% 	16	*	0s
Profile oxviewconfig::getViewConfigParam: 	4.0E-5s	2.91% 	24	*	0s
Profile isSearchEngine: 	2.0E-5s	1.14% 	1	*	2.0E-5s
Profile fround: 	1.0E-5s	1.05% 	9	*	0s
Profile articleAssignParentInternal: 	1.0E-5s	0.76% 	3	*	0s
Profile _applyVAT: 	1.0E-5s	0.52% 	2	*	0s


cl=oxwcurrencylist(show/hide)
Memory usage: 6.533 MB (peak: 146.438 MB)
System memory usage: 27 MB (peak: 147 MB)
Executed: 2018-06-22 09:46:42
Timestamp: 1529653602.8134
Execution time:0.001
----------------------------------------------------------
Profile process: 	3.63808s	351513.68% 	5	*	0.72762s
Profile oxNew: 	0.01982s	1914.88% 	109	*	0.00018s
Profile oxAutoload: 	0.00706s	681.87% 	91	*	8.0E-5s
Profile buildTree: 	0.00351s	339.53% 	1	*	0.00351s
Profile articleAssign: 	0.001s	96.41% 	3	*	0.00033s
Profile smarty_function_oxmultilang: 	0.00068s	65.84% 	25	*	3.0E-5s
Profile seoencoder_loadFromCache: 	0.00052s	50.15% 	12	*	4.0E-5s
Profile _getAmountPrice: 	0.00049s	47.73% 	1	*	0.00049s
Profile _getLangTranslationArray: 	0.00044s	42.78% 	35	*	1.0E-5s
Profile loadinglists: 	0.00031s	30.22% 	2	*	0.00016s
Profile executeMaintenanceTasks: 	0.00027s	25.98% 	1	*	0.00027s
Profile getArticleUri: 	0.00021s	20.69% 	4	*	5.0E-5s
Profile getCategoryUri: 	0.00016s	15.18% 	2	*	8.0E-5s
Profile _assignPriceInternal: 	7.0E-5s	7.05% 	1	*	7.0E-5s
Profile oxviewconfig::setViewConfigParam: 	5.0E-5s	5.11% 	18	*	0s
Profile oxviewconfig::getViewConfigParam: 	4.0E-5s	3.8% 	25	*	0s
Profile isSearchEngine: 	2.0E-5s	1.45% 	1	*	2.0E-5s
Profile fround: 	1.0E-5s	1.34% 	9	*	0s
Profile articleAssignParentInternal: 	1.0E-5s	0.97% 	3	*	0s
Profile _applyVAT: 	1.0E-5s	0.67% 	2	*	0s


cl=oxwservicemenu(show/hide)
Memory usage: 6.797 MB (peak: 146.438 MB)
System memory usage: 27 MB (peak: 147 MB)
Executed: 2018-06-22 09:46:42
Timestamp: 1529653602.8155
Execution time:0.0019
----------------------------------------------------------
Profile process: 	3.63996s	191773.85% 	6	*	0.60666s
Profile oxNew: 	0.02026s	1067.45% 	114	*	0.00018s
Profile oxAutoload: 	0.00719s	378.82% 	93	*	8.0E-5s
Profile buildTree: 	0.00351s	185.14% 	1	*	0.00351s
Profile articleAssign: 	0.001s	52.57% 	3	*	0.00033s
Profile smarty_function_oxmultilang: 	0.00082s	43.14% 	38	*	2.0E-5s
Profile seoencoder_loadFromCache: 	0.00053s	27.9% 	16	*	3.0E-5s
Profile _getLangTranslationArray: 	0.00051s	26.87% 	49	*	1.0E-5s
Profile _getAmountPrice: 	0.00049s	26.03% 	1	*	0.00049s
Profile loadinglists: 	0.00031s	16.48% 	2	*	0.00016s
Profile executeMaintenanceTasks: 	0.00027s	14.17% 	1	*	0.00027s
Profile getArticleUri: 	0.00021s	11.28% 	4	*	5.0E-5s
Profile getCategoryUri: 	0.00016s	8.28% 	2	*	8.0E-5s
Profile _assignPriceInternal: 	7.0E-5s	3.84% 	1	*	7.0E-5s
Profile oxviewconfig::setViewConfigParam: 	6.0E-5s	3.12% 	24	*	0s
Profile oxviewconfig::getViewConfigParam: 	5.0E-5s	2.52% 	35	*	0s
Profile isSearchEngine: 	2.0E-5s	0.79% 	1	*	2.0E-5s
Profile fround: 	1.0E-5s	0.73% 	9	*	0s
Profile articleAssignParentInternal: 	1.0E-5s	0.53% 	3	*	0s
Profile _applyVAT: 	1.0E-5s	0.36% 	2	*	0s


cl=oxwminibasket(show/hide)
Memory usage: 6.933 MB (peak: 146.438 MB)
System memory usage: 27 MB (peak: 147 MB)
Executed: 2018-06-22 09:46:42
Timestamp: 1529653602.8166
Execution time:0.0011
----------------------------------------------------------
Profile process: 	3.64103s	338390.85% 	7	*	0.52015s
Profile oxNew: 	0.02042s	1897.7% 	117	*	0.00017s
Profile oxAutoload: 	0.00723s	671.77% 	94	*	8.0E-5s
Profile buildTree: 	0.00351s	326.59% 	1	*	0.00351s
Profile articleAssign: 	0.001s	92.73% 	3	*	0.00033s
Profile smarty_function_oxmultilang: 	0.00083s	77.49% 	39	*	2.0E-5s
Profile seoencoder_loadFromCache: 	0.00053s	49.5% 	17	*	3.0E-5s
Profile _getLangTranslationArray: 	0.00052s	48.53% 	51	*	1.0E-5s
Profile _getAmountPrice: 	0.00049s	45.91% 	1	*	0.00049s
Profile loadinglists: 	0.00031s	29.07% 	2	*	0.00016s
Profile executeMaintenanceTasks: 	0.00027s	24.99% 	1	*	0.00027s
Profile getArticleUri: 	0.00021s	19.9% 	4	*	5.0E-5s
Profile getCategoryUri: 	0.00016s	14.6% 	2	*	8.0E-5s
Profile _assignPriceInternal: 	7.0E-5s	6.78% 	1	*	7.0E-5s
Profile oxviewconfig::setViewConfigParam: 	6.0E-5s	5.58% 	26	*	0s
Profile oxviewconfig::getViewConfigParam: 	5.0E-5s	4.56% 	36	*	0s
Profile isSearchEngine: 	2.0E-5s	1.4% 	1	*	2.0E-5s
Profile fround: 	1.0E-5s	1.29% 	9	*	0s
Profile articleAssignParentInternal: 	1.0E-5s	0.93% 	3	*	0s
Profile _applyVAT: 	1.0E-5s	0.64% 	2	*	0s


cl=oxwcategorytree(show/hide)
Memory usage: 7.124 MB (peak: 146.438 MB)
System memory usage: 27 MB (peak: 147 MB)
Executed: 2018-06-22 09:46:42
Timestamp: 1529653602.8188
Execution time:0.0019
----------------------------------------------------------
Profile process: 	3.64293s	190115.22% 	8	*	0.45537s
Profile oxNew: 	0.02058s	1073.8% 	120	*	0.00017s
Profile oxAutoload: 	0.00727s	379.15% 	95	*	8.0E-5s
Profile buildTree: 	0.00351s	183.39% 	1	*	0.00351s
Profile articleAssign: 	0.001s	52.07% 	3	*	0.00033s
Profile smarty_function_oxmultilang: 	0.00088s	45.91% 	43	*	2.0E-5s
Profile seoencoder_loadFromCache: 	0.00057s	29.95% 	35	*	2.0E-5s
Profile _getLangTranslationArray: 	0.00055s	28.65% 	56	*	1.0E-5s
Profile _getAmountPrice: 	0.00049s	25.78% 	1	*	0.00049s
Profile getCategoryUri: 	0.00043s	22.47% 	20	*	2.0E-5s
Profile loadinglists: 	0.00031s	16.32% 	2	*	0.00016s
Profile executeMaintenanceTasks: 	0.00027s	14.04% 	1	*	0.00027s
Profile getArticleUri: 	0.00021s	11.17% 	4	*	5.0E-5s
Profile _assignPriceInternal: 	7.0E-5s	3.81% 	1	*	7.0E-5s
Profile oxviewconfig::setViewConfigParam: 	6.0E-5s	3.25% 	31	*	0s
Profile oxviewconfig::getViewConfigParam: 	5.0E-5s	2.85% 	41	*	0s
Profile isSearchEngine: 	2.0E-5s	0.78% 	1	*	2.0E-5s
Profile fround: 	1.0E-5s	0.72% 	9	*	0s
Profile articleAssignParentInternal: 	1.0E-5s	0.52% 	3	*	0s
Profile _applyVAT: 	1.0E-5s	0.36% 	2	*	0s


cl=oxwarticledetails(show/hide)
Memory usage: 6.111 MB (peak: 146.438 MB)
System memory usage: 27 MB (peak: 147 MB)
Executed: 2018-06-22 09:46:42
Timestamp: 1529653602.8083
Execution time:3.6349
----------------------------------------------------------
Profile process: 	3.63465s	99.99% 	2	*	1.81733s
Profile oxNew: 	0.01886s	0.52% 	100	*	0.00019s
Profile oxAutoload: 	0.00686s	0.19% 	88	*	8.0E-5s
Profile buildTree: 	0.00351s	0.1% 	1	*	0.00351s
Profile articleAssign: 	0.001s	0.03% 	3	*	0.00033s
Profile smarty_function_oxmultilang: 	0.00068s	0.02% 	25	*	3.0E-5s
Profile seoencoder_loadFromCache: 	0.00052s	0.01% 	12	*	4.0E-5s
Profile _getAmountPrice: 	0.00049s	0.01% 	1	*	0.00049s
Profile _getLangTranslationArray: 	0.00041s	0.01% 	32	*	1.0E-5s
Profile loadinglists: 	0.00031s	0.01% 	2	*	0.00016s
Profile executeMaintenanceTasks: 	0.00027s	0.01% 	1	*	0.00027s
Profile getArticleUri: 	0.00021s	0.01% 	4	*	5.0E-5s
Profile getCategoryUri: 	0.00016s	0% 	2	*	8.0E-5s
Profile _assignPriceInternal: 	7.0E-5s	0% 	1	*	7.0E-5s
Profile oxviewconfig::getViewConfigParam: 	3.0E-5s	0% 	19	*	0s
Profile isSearchEngine: 	2.0E-5s	0% 	1	*	2.0E-5s
Profile fround: 	1.0E-5s	0% 	9	*	0s
Profile articleAssignParentInternal: 	1.0E-5s	0% 	3	*	0s
Profile _applyVAT: 	1.0E-5s	0% 	2	*	0s
Profile oxviewconfig::setViewConfigParam: 	1.0E-5s	0% 	9	*	0s


cl=oxwservicelist(show/hide)
Memory usage: 7.318 MB (peak: 146.438 MB)
System memory usage: 27 MB (peak: 147 MB)
Executed: 2018-06-22 09:46:42
Timestamp: 1529653602.821
Execution time:0.0015
----------------------------------------------------------
Profile process: 	3.64447s	235604.22% 	9	*	0.40494s
Profile oxNew: 	0.02092s	1352.4% 	125	*	0.00017s
Profile oxAutoload: 	0.00739s	477.48% 	97	*	8.0E-5s
Profile buildTree: 	0.00351s	227.17% 	1	*	0.00351s
Profile articleAssign: 	0.001s	64.5% 	3	*	0.00033s
Profile smarty_function_oxmultilang: 	0.00098s	63.27% 	51	*	2.0E-5s
Profile seoencoder_loadFromCache: 	0.00068s	43.83% 	38	*	2.0E-5s
Profile _getLangTranslationArray: 	0.0006s	38.53% 	65	*	1.0E-5s
Profile _getAmountPrice: 	0.00049s	31.94% 	1	*	0.00049s
Profile getCategoryUri: 	0.00043s	28.02% 	21	*	2.0E-5s
Profile loadinglists: 	0.00031s	20.22% 	2	*	0.00016s
Profile executeMaintenanceTasks: 	0.00027s	17.39% 	1	*	0.00027s
Profile getArticleUri: 	0.00021s	13.84% 	4	*	5.0E-5s
Profile _assignPriceInternal: 	7.0E-5s	4.72% 	1	*	7.0E-5s
Profile oxviewconfig::setViewConfigParam: 	6.0E-5s	4.15% 	34	*	0s
Profile oxviewconfig::getViewConfigParam: 	6.0E-5s	3.73% 	46	*	0s
Profile isSearchEngine: 	2.0E-5s	0.97% 	1	*	2.0E-5s
Profile fround: 	1.0E-5s	0.89% 	9	*	0s
Profile articleAssignParentInternal: 	1.0E-5s	0.65% 	3	*	0s
Profile _applyVAT: 	1.0E-5s	0.45% 	2	*	0s


cl=oxwinformation(show/hide)
Memory usage: 7.572 MB (peak: 146.438 MB)
System memory usage: 27 MB (peak: 147 MB)
Executed: 2018-06-22 09:46:42
Timestamp: 1529653602.8237
Execution time:0.0026
----------------------------------------------------------
Profile process: 	3.64709s	138196.83% 	10	*	0.36471s
Profile oxNew: 	0.02114s	800.89% 	136	*	0.00016s
Profile oxAutoload: 	0.00742s	281.31% 	98	*	8.0E-5s
Profile buildTree: 	0.00351s	133.16% 	1	*	0.00351s
Profile articleAssign: 	0.001s	37.81% 	3	*	0.00033s
Profile smarty_function_oxmultilang: 	0.00099s	37.55% 	52	*	2.0E-5s
Profile seoencoder_loadFromCache: 	0.0007s	26.41% 	45	*	2.0E-5s
Profile _getLangTranslationArray: 	0.00061s	23.08% 	67	*	1.0E-5s
Profile _getAmountPrice: 	0.00049s	18.72% 	1	*	0.00049s
Profile getCategoryUri: 	0.00043s	16.42% 	21	*	2.0E-5s
Profile loadinglists: 	0.00031s	11.85% 	2	*	0.00016s
Profile executeMaintenanceTasks: 	0.00027s	10.19% 	1	*	0.00027s
Profile getArticleUri: 	0.00021s	8.11% 	4	*	5.0E-5s
Profile _assignPriceInternal: 	7.0E-5s	2.76% 	1	*	7.0E-5s
Profile oxviewconfig::setViewConfigParam: 	7.0E-5s	2.48% 	35	*	0s
Profile oxviewconfig::getViewConfigParam: 	6.0E-5s	2.19% 	46	*	0s
Profile isSearchEngine: 	2.0E-5s	0.57% 	1	*	2.0E-5s
Profile fround: 	1.0E-5s	0.52% 	9	*	0s
Profile articleAssignParentInternal: 	1.0E-5s	0.38% 	3	*	0s
Profile _applyVAT: 	1.0E-5s	0.26% 	2	*	0s


cl=oxwmanufacturerlist(show/hide)
Memory usage: 7.708 MB (peak: 146.438 MB)
System memory usage: 27 MB (peak: 147 MB)
Executed: 2018-06-22 09:46:42
Timestamp: 1529653602.8244
Execution time:0.0006
----------------------------------------------------------
Profile process: 	3.64763s	656058.36% 	11	*	0.3316s
Profile oxNew: 	0.02132s	3833.79% 	139	*	0.00015s
Profile oxAutoload: 	0.00747s	1343.18% 	99	*	8.0E-5s
Profile buildTree: 	0.00351s	632.03% 	1	*	0.00351s
Profile smarty_function_oxmultilang: 	0.00101s	180.92% 	53	*	2.0E-5s
Profile articleAssign: 	0.001s	179.46% 	3	*	0.00033s
Profile seoencoder_loadFromCache: 	0.0007s	125.34% 	45	*	2.0E-5s
Profile _getLangTranslationArray: 	0.00062s	112.05% 	69	*	1.0E-5s
Profile _getAmountPrice: 	0.00049s	88.85% 	1	*	0.00049s
Profile getCategoryUri: 	0.00043s	77.96% 	21	*	2.0E-5s
Profile loadinglists: 	0.00031s	56.26% 	2	*	0.00016s
Profile executeMaintenanceTasks: 	0.00027s	48.37% 	1	*	0.00027s
Profile getArticleUri: 	0.00021s	38.51% 	4	*	5.0E-5s
Profile _assignPriceInternal: 	7.0E-5s	13.12% 	1	*	7.0E-5s
Profile oxviewconfig::setViewConfigParam: 	7.0E-5s	11.92% 	36	*	0s
Profile oxviewconfig::getViewConfigParam: 	6.0E-5s	10.38% 	46	*	0s
Profile isSearchEngine: 	2.0E-5s	2.7% 	1	*	2.0E-5s
Profile fround: 	1.0E-5s	2.49% 	9	*	0s
Profile articleAssignParentInternal: 	1.0E-5s	1.8% 	3	*	0s
Profile _applyVAT: 	1.0E-5s	1.24% 	2	*	0s


cl=oxwcategorytree(show/hide)
Memory usage: 7.746 MB (peak: 146.438 MB)
System memory usage: 27 MB (peak: 147 MB)
Executed: 2018-06-22 09:46:42
Timestamp: 1529653602.8251
Execution time:0.0006
----------------------------------------------------------
Profile process: 	3.64823s	599129.84% 	12	*	0.30402s
Profile oxNew: 	0.02133s	3503.72% 	142	*	0.00015s
Profile oxAutoload: 	0.00747s	1226.43% 	99	*	8.0E-5s
Profile buildTree: 	0.00351s	577.09% 	1	*	0.00351s
Profile smarty_function_oxmultilang: 	0.00102s	167.66% 	54	*	2.0E-5s
Profile articleAssign: 	0.001s	163.86% 	3	*	0.00033s
Profile seoencoder_loadFromCache: 	0.0007s	114.45% 	45	*	2.0E-5s
Profile _getLangTranslationArray: 	0.00064s	104.46% 	71	*	1.0E-5s
Profile _getAmountPrice: 	0.00049s	81.13% 	1	*	0.00049s
Profile getCategoryUri: 	0.00043s	71.18% 	21	*	2.0E-5s
Profile loadinglists: 	0.00031s	51.37% 	2	*	0.00016s
Profile executeMaintenanceTasks: 	0.00027s	44.17% 	1	*	0.00027s
Profile getArticleUri: 	0.00021s	35.16% 	4	*	5.0E-5s
Profile _assignPriceInternal: 	7.0E-5s	11.98% 	1	*	7.0E-5s
Profile oxviewconfig::setViewConfigParam: 	7.0E-5s	11.04% 	37	*	0s
Profile oxviewconfig::getViewConfigParam: 	6.0E-5s	9.48% 	46	*	0s
Profile isSearchEngine: 	2.0E-5s	2.47% 	1	*	2.0E-5s
Profile fround: 	1.0E-5s	2.27% 	9	*	0s
Profile articleAssignParentInternal: 	1.0E-5s	1.64% 	3	*	0s
Profile _applyVAT: 	1.0E-5s	1.14% 	2	*	0s


cl=details(show/hide)
Memory usage: 7.898 MB (peak: 146.438 MB)
System memory usage: 27 MB (peak: 147 MB)
Executed: 2018-06-22 09:46:42
Timestamp: 1529653602.8303
Execution time:7.2862
----------------------------------------------------------
Profile process: 	3.65394s	50.15% 	12	*	0.3045s
Profile oxNew: 	0.02147s	0.29% 	147	*	0.00015s
Profile oxAutoload: 	0.00749s	0.1% 	100	*	7.0E-5s
Profile buildTree: 	0.00351s	0.05% 	1	*	0.00351s
Profile smarty_function_oxmultilang: 	0.00113s	0.02% 	64	*	2.0E-5s
Profile articleAssign: 	0.001s	0.01% 	3	*	0.00033s
Profile seoencoder_loadFromCache: 	0.00071s	0.01% 	49	*	1.0E-5s
Profile _getLangTranslationArray: 	0.00069s	0.01% 	82	*	1.0E-5s
Profile _getAmountPrice: 	0.00049s	0.01% 	1	*	0.00049s
Profile getArticleMainUri: 	0.00045s	0.01% 	2	*	0.00022s
Profile getCategoryUri: 	0.00043s	0.01% 	21	*	2.0E-5s
Profile loadinglists: 	0.00031s	0% 	2	*	0.00016s
Profile executeMaintenanceTasks: 	0.00027s	0% 	1	*	0.00027s
Profile getArticleUri: 	0.00021s	0% 	4	*	5.0E-5s
Profile _assignPriceInternal: 	7.0E-5s	0% 	1	*	7.0E-5s
Profile oxviewconfig::setViewConfigParam: 	7.0E-5s	0% 	38	*	0s
Profile oxviewconfig::getViewConfigParam: 	6.0E-5s	0% 	48	*	0s
Profile isSearchEngine: 	2.0E-5s	0% 	1	*	2.0E-5s
Profile fround: 	1.0E-5s	0% 	9	*	0s
Profile articleAssignParentInternal: 	1.0E-5s	0% 	3	*	0s
Profile _applyVAT: 	1.0E-5s	0% 	2	*	0s
Profile parseThroughSmarty: 	0s	0% 	1	*	0s
Hallo.
Gruss
Marcel
Die ganze Seite. Du kannst mal in core/oxshopcontrol.php folgendes ändern:
startProfile('process');
in
startProfile('process_' . $sClass);
und
stopProfile('process');
in
stopProfile('process_' . $sClass);
und dann nochmal profilen.
Hallo zusammen,
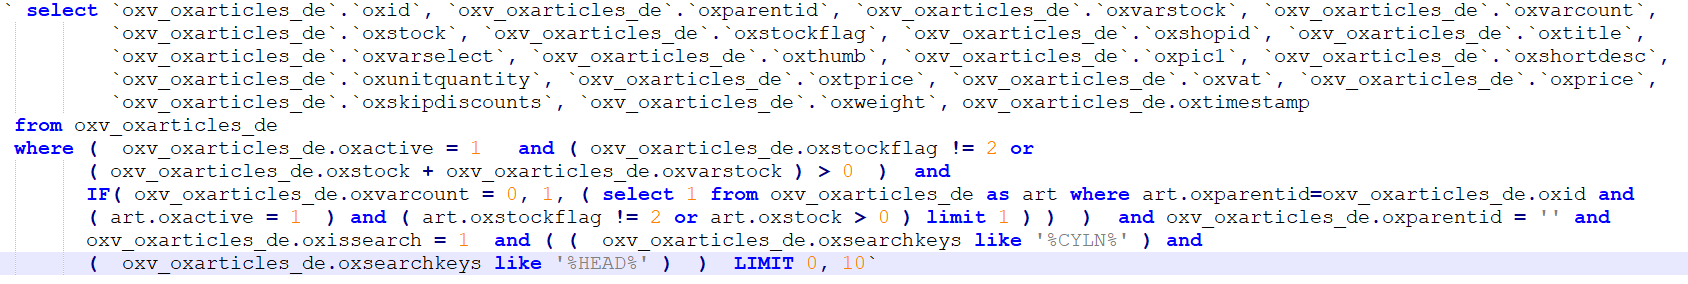
sorry für die lange Antwortzeit aber ich habe etwas Zeit für ander Dinge benötigt.@mws_1941 : Ich habe das slow_query_log eingeschaltet und das Logfile geprüft.
(Sorry für das Bild, aber anders kann ich das hier nicht posten -> Fehlermeldung)
Wenn ich das in phpmyadmin nachstelle dauert die Abfrage 10,3064 Sekunden.
Insofern gehe ich von der Datenbank aus.
@leofonic :
Zusammenfassung
cl=oxwcookienote(show/hide)
cl=details(show/hide)
Memory usage: 8.066 MB (peak: 129.598 MB)
System memory usage: 9.25 MB (peak: 130.25 MB)
Executed: 2018-07-17 11:32:47
Timestamp: 1531819967.0901
Execution time:13.4413
----------------------------------------------------------
Profile process_details:	13.44153s	100%	1	*	13.44153s
Profile process_oxwarticledetails:	8.55721s	63.66%	1	*	8.55721s
Profile getArticleUri:	0.03015s	0.22%	6	*	0.00503s
Profile _createArticleCategoryUri:	0.02631s	0.2%	2	*	0.01316s
Profile oxNew:	0.02259s	0.17%	152	*	0.00015s
Profile oxAutoload:	0.00782s	0.06%	100	*	8.0E-5s
Profile buildTree:	0.00526s	0.04%	1	*	0.00526s
Profile getCategoryUri:	0.00396s	0.03%	23	*	0.00017s
Profile process_oxwinformation:	0.00301s	0.02%	1	*	0.00301s
Profile process_oxwcategorytree:	0.00286s	0.02%	2	*	0.00143s
Profile _getLangTranslationArray:	0.00248s	0.02%	90	*	3.0E-5s
Profile process_oxwservicemenu:	0.00236s	0.02%	1	*	0.00236s
Profile loadinglists:	0.00211s	0.02%	2	*	0.00105s
Profile process_oxwservicelist:	0.00182s	0.01%	1	*	0.00182s
Profile process_oxwcurrencylist:	0.00149s	0.01%	1	*	0.00149s
Profile process_oxwlanguagelist:	0.00148s	0.01%	1	*	0.00148s
Profile articleAssign:	0.00145s	0.01%	6	*	0.00024s
Profile process_oxwminibasket:	0.00126s	0.01%	1	*	0.00126s
Profile smarty_function_oxmultilang:	0.001s	0.01%	65	*	2.0E-5s
Profile seoencoder_loadFromCache:	0.00097s	0.01%	53	*	2.0E-5s
Profile process_oxwcookienote:	0.00077s	0.01%	1	*	0.00077s
Profile getArticleMainUri:	0.00069s	0.01%	2	*	0.00034s
Profile process_oxwmanufacturerlist:	0.0006s	0%	1	*	0.0006s
Profile _getAmountPrice:	0.00059s	0%	1	*	0.00059s
Profile seoencoder_saveInCache:	0.00041s	0%	8	*	5.0E-5s
Profile executeMaintenanceTasks:	0.0003s	0%	1	*	0.0003s
Profile !__SAVING CACHE__! (warning):	0.00014s	0%	1	*	0.00014s
Profile _assignPriceInternal:	0.00012s	0%	1	*	0.00012s
Profile oxviewconfig::getViewConfigParam:	6.0E-5s	0%	48	*	0s
Profile oxviewconfig::setViewConfigParam:	4.0E-5s	0%	38	*	0s
Profile articleAssignParentInternal:	2.0E-5s	0%	5	*	0s
Profile isSearchEngine:	2.0E-5s	0%	1	*	2.0E-5s
Profile fround:	1.0E-5s	0%	9	*	0s
Profile _applyVAT:	1.0E-5s	0%	2	*	0s
Profile parseThroughSmarty:	0s	0%	1	*	0s
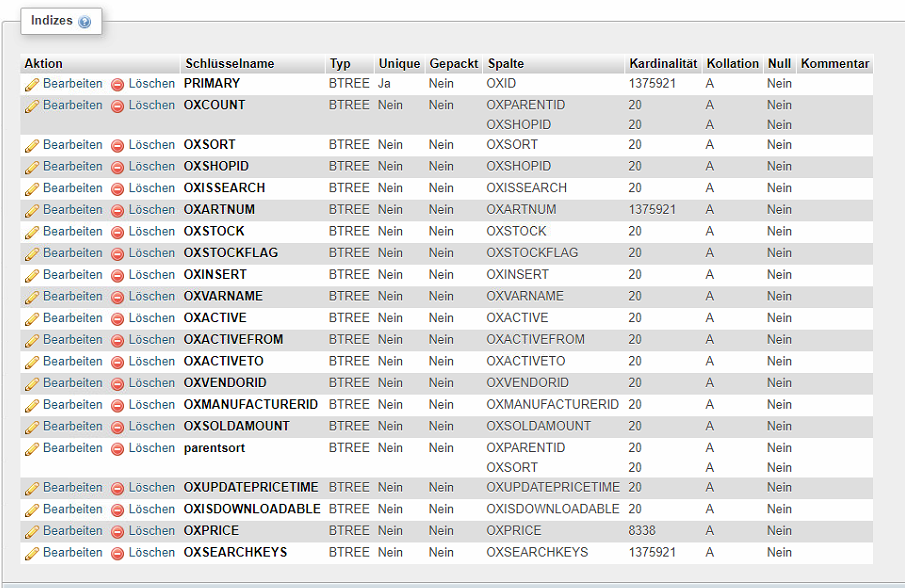
es scheint so dass Indices zumindest bei Tabelle oxarticles fehlen. Evtl auch views neu erstellen …
Inidzes sehen in meinen Augen gut aus:
zum Suchen im Titel muss bei der Anzahl Artikel auch ein Index für oxtitle angelegt sein - wird natürlich bei 1,3 mio Artikel sehr gross.
Jedenfalls deutlich schneller.
details
Alles andere im vernachlässigbaren Bereich (0,00x s)
auch da ist sicher noch Verbesserungspotential trotz 1,3mio Artikel - ist aber eine andere Baustelle …
Ein Index wird bei “like ‘%word%’” nicht verwendet. Man könnte das evtl. umschreiben zu “match against” mit Fulltext Index oder eine externe Suche verwenden.
bei 1,3 Mille glaube ich auch, dass irgendwas nosql-elasticsearch-mäßiges deutlich besser wäre
Man könnte auch mal die Anzahl der Felder reduzieren und die die man braucht in ein Feld zusammenkopieren, wird sowieso nicht sortiert, und dieses Feld in oxarticles ablegen dann fällt schonmal der Join weg.
PS: der Grund warum die Suche beim einzelnen Artikel nochmal ausgeführt wird, und der Shop daher beim einzelnen Artikel nicht schneller als bei der Suche selbst ist, ist der Locator, um die Position des Artikels beim “vorheriger/nächster Artikel” und “zurück zur Übersicht” zu bestimmen.
leofonic:
PS: der Grund warum die Suche beim einzelnen Artikel nochmal ausgeführt wird, und der Shop daher beim einzelnen Artikel nicht schneller als bei der Suche selbst ist, ist der Locator, um die Position des Artikels beim “vorheriger/nächster Artikel” und “zurück zur Übersicht” zu bestimmen
Das ist ein guter Hinweis, danke. Denn ich habe bisher nicht verstanden wieso er beim Aufruf des gleichen Artikels länger braucht als aus der Kategorie heraus.
Das bedeutet, dass er sich die Suche speichert und dann immer wieder erneut ausführt?
leofonic:
Man könnte auch mal die Anzahl der Felder reduzieren und die die man braucht in ein Feld zusammenkopieren, wird sowieso nicht sortiert, und dieses Feld in oxarticles ablegen dann fällt schonmal der Join weg
Könntest du mir dazu ein Beispiel nennen?
Wenn man natürlich ständig sucht, dann ist das richtig. Mir was diese Funktion bisher nicht bewusst. Ich glaube aber dass 95% der Kunden nach einer Suche den Artikel aufrufen und von da aus nicht zurück zur Suche wollen und nicht durch die Suchergebnisse scrollen möchten. Das wird in der Regel vorher passieren. Insofern wäre es vll. tatsächlich ein Ansatz hier zu optimieren.
Das ist in Application/Component/Locator::_setSearchLocatorData. Könnte man abschalten wenn man die entsprechenden Links aus dem Template nimmt. Oder du schaust dir beim Searchcontroller die Methode “getAddUrlParams” an, da werden die Parameter an die Artikelurl gehängt wodurch der Artikel als Teil einer Suche geladen wird.
Du kannst im Backend die Felder eintragen in denen gesucht wird. Da könntest du ein Feld eintragen dass du selbst in oxarticles erstellst, z.B. “searchdata”, und in dieses Feld schreibst du per cronjob alle Wörter rein unter denen der Artikel gefunden werden soll. Ob das was bringen würde kannst du mal grob testen indem du die Felder mal reduzierst, indem du z.B. oxtags entfernst fällt schon mal der Join weg.
Ich habe nun ein wenig experimentiert
Ich habe testweise alles rausgenommen aus “oxsearchkeys”. Dort könnte ich in der Theorie ja auch ohne eigenes Feld verschiedene Begriffe eingeben.
leofonic:
Das ist in Application/Component/Locator::_setSearchLocatorData. Könnte man abschalten wenn man die entsprechenden Links aus dem Template nimmt. Oder du schaust dir beim Searchcontroller die Methode “getAddUrlParams” an, da werden die Parameter an die Artikelurl gehängt wodurch der Artikel als Teil einer Suche geladen wird.
Das scheint grundsätzlich nur zu funktionieren, wenn ich SEO Urls ausschalte, richtig?
Damit konnte ich in den URLs ein bisschen “spielen”.
index.php?cl=details&anid=01110cca4bb1b6d25e76dec616aa3cde&listtype=search&searchparam=12395-KFL-850
wenn ich nun die URL so manipuliere, dass listtype nicht “search” sondern “list” ist und “searchparam” entferne erhalte ich eine sehr schnelle Ladezeit.
Das Problem: Wird dabei ein Artikel geöffnet, der keiner Kategorie zugeordnet ist, dann steht da “Artikel von” weil die fehlenden Informationen nicht übermittelt werden können.
Könnte man hier auf die Suche zurückspringen? Also komme ich ohne diese Parameter in der URL anzugeben noch irgendwie an diese Informationen heran?
Wenn ich nun einen eigenen Parameter definiere (customsearchparam) könnte ich diesen im Template verarbeiten und damit einen neuen Link generieren?
Dann bliebe nur noch das Problem: Wieso funktioniert das nicht mit SEO Urls? Gibt es dafür noch einen Workaround?
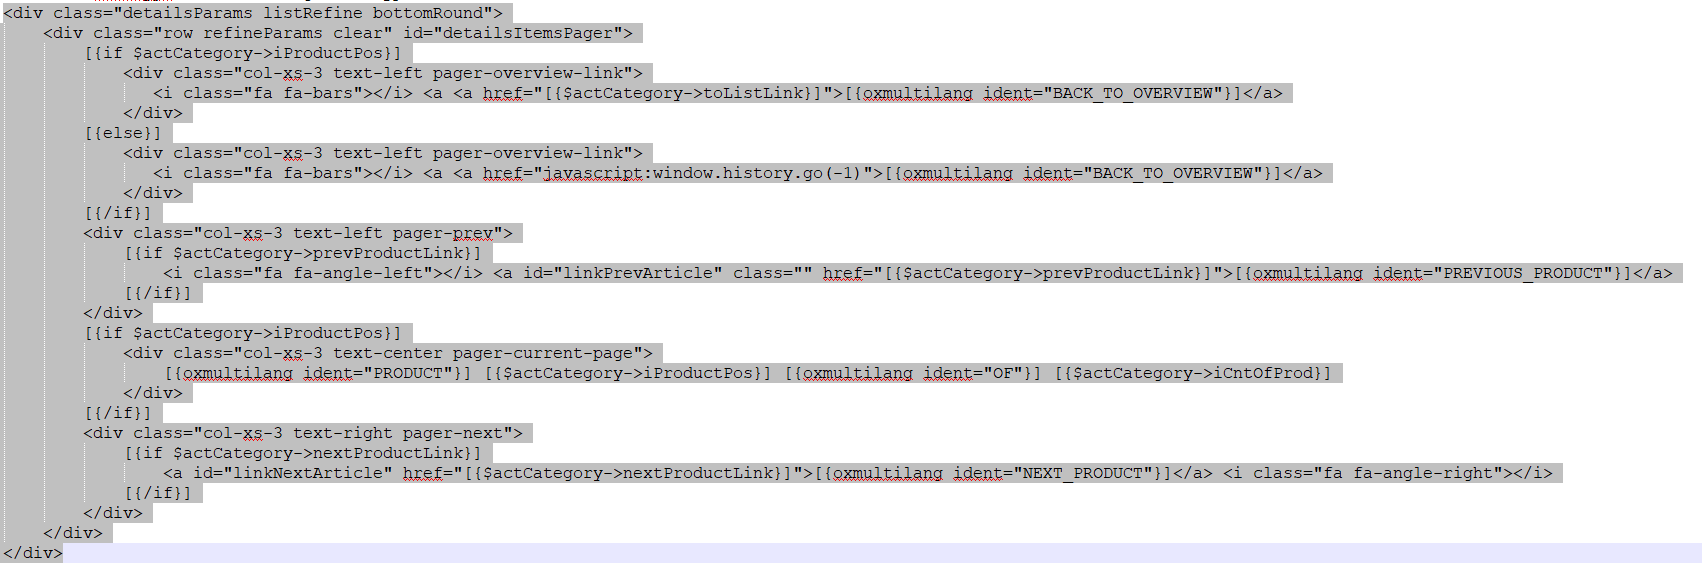
Das funktioniert auch mit SEO-Urls. Die Parameter können alle entfernt werden, listtype “list” ist nicht notwendig. Den Zurück-Button könnte man einfach mit Javascript window.history.go(-1) machen.
Sobald ich in der config.inc $this->blSeoMode = false; auf true setze greifen meine Änderungen nicht mehr.
Ich muss das sicherlich noch in ein Modul umbauen aber testweise habe ich folgende Elemente auskommentiert:
in der search.tpl in der Funktion getAddUrlParams():
Das widerum funktioniert gut:
leofonic:
Du kannst im Backend die Felder eintragen in denen gesucht wird. Da könntest du ein Feld eintragen dass du selbst in oxarticles erstellst, z.B. “searchdata”, und in dieses Feld schreibst du per cronjob alle Wörter rein unter denen der Artikel gefunden werden soll. Ob das was bringen würde kannst du mal grob testen indem du die Felder mal reduzierst, indem du z.B. oxtags entfernst fällt schon mal der Join weg.
Das hier habe ich auch nochmal geprüft. Beispielhaft ein Statement das dadurch ausgeführt wird:
Das Statement über phpmyadmin ausgeführt dauert über 6 Sekunden. Nach zwei-dreimaliger Ausführung nur noch 0,005 Sekunden. Scheint also dann gecached zu werden.
SQL: … WHERE oxsearchkeys=124-456-789 OR oxsearchkeys=124456789 OR oxsearchkeys=CYL-HEAD OR oxsearchkeys=CYLHEAD
Das würde natürlich ein wenig Komfort einbüßen, man würde aber die Ergebnisse über das Backend beeinflussen können.
Wenn man das like weglässt, kann man kein wildcard verwenden, so würde nur das gefunden werden was exakt so im Feld steht. Dazu bräuchte man einen inverted index wie er z.B. von Elasticsearch/Lucene verwendet wird.
Graschi
August 12, 2018, 12:42pm
19
Weiß ich und versuchte ich zu beschreiben:
Graschi:
Die LIKE-Suche ist natürlich komfortabel um viele Artikel zu finden. Die Idee wäre nun alle String, die als Suchstring im Backend angegeben sind, für die Ergebnismenge zu nutzen. Also Beispiel:
Man müsste das nun so umbauen, dass die Benutzereingabe jeweils mit einer =Suche gegen jeden durch Komma separierten Teilstring geht. Ggf. müsste oxsearchkeys aufgeteilt werden.
Man würde dadurch Komfort verlieren weil eben der Benutzer nur wenige Varianten hat um einen Artikel zu finden wenn man sich aber auf die wichtigsten beschränkt (bei einer Artikelnummer mit und ohne Bindestrich) wäre es ein Performancegewinn.
Mir fällt eben sonst nicht ein wie das optimiert werden sollte. Vorschläge nehme ich gerne an.
Eine echte Volltextsuchmaschine verwenden. Solr oder Elasticsearch z.B.
Gruss